Survey Demographics
In order to get an idea for the level of political polarization present in society, I conducted informal data collection from my peers regarding political opinions. This survey should not be viewed as an incredibly accurate snapshot into the range of political opinions present in America. Due to limitations of the semester and my outreach capabilities, the survey does not draw from a statistically representative sample of the American electorate. The individuals who responded to the survey were primarily young college students in the D.C. area. The survey received a total of 51 responses, which encompass a variety of different viewpoints.
The first two questions on the survey were:
These questions were intended to establish a control by which respondent's future answers could be compared to the platform of their supposed party. It was important to distinguish party allegiance from voting preferences however, as while some individuals may ideologically align themselves with a smaller, third party, they still may vote with one of the two major parties. The distribution of responses for the two questions can be viewed below:
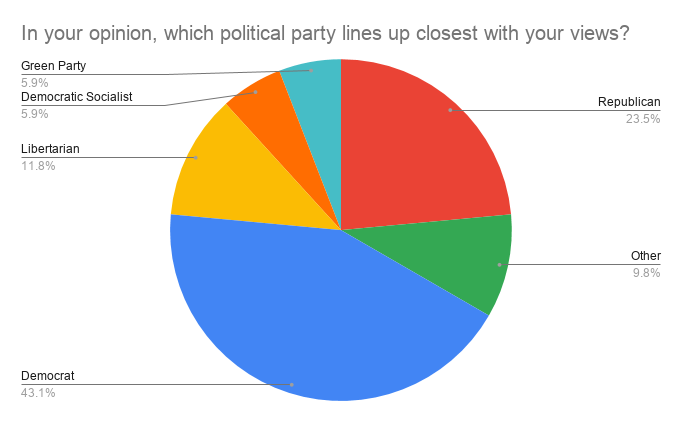
The first two questions on the survey were:
- In your opinion, which political party lines up closest with your views?
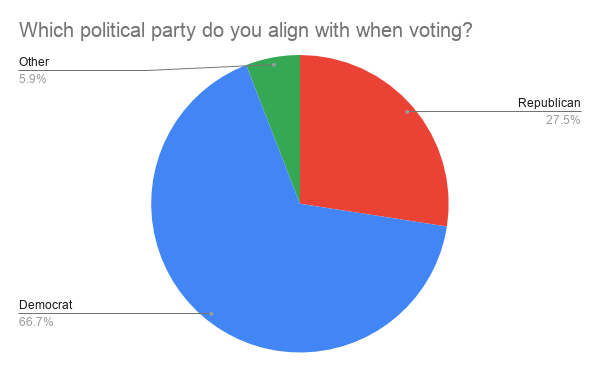
- Which political party do you align with when voting?
These questions were intended to establish a control by which respondent's future answers could be compared to the platform of their supposed party. It was important to distinguish party allegiance from voting preferences however, as while some individuals may ideologically align themselves with a smaller, third party, they still may vote with one of the two major parties. The distribution of responses for the two questions can be viewed below:
|
|
This data brings up some very interesting points. As can clearly be seen in the graphs above, individuals must compromise their specific party views when voting. While 66.7% of individuals surveyed choose to vote Democrat, only 43.1% ideologically align with the Democratic party. Similarly, while 27.5% of individuals vote Republican, only 23.5% identify ideologically as Republican. This also gives an interesting look into the division that occurs within parties. Of the 14 individuals surveyed who voted Republican, 12 identified ideologically as Republican. Of the 34 individuals surveyed who voted Democrat, 22 identified ideologically as Democrats. This shows that 85.7% of those who voted Republican, identified with the Republican party, while only 64.7% for the Democrats. This may be a sign of more internal division within the Democratic party, as opposed to the Republican party.
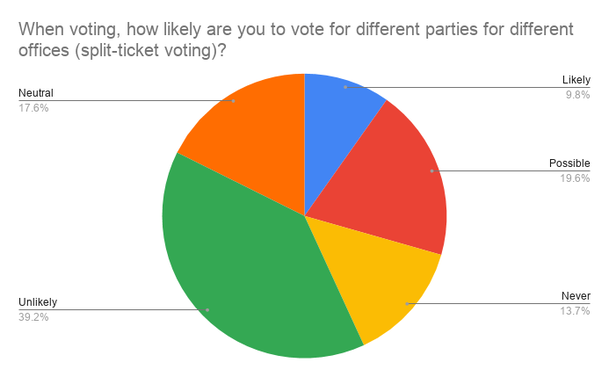
A worrying scenario about the future of American politics also exists in the fact that Americans tend to be so passionate about their political views that they refuse to even consider the proposals of the other party. Split ticket voting, or voting for two parties on the same ticket, has become less prevalent with the rise of political polarization, and the negative opinions surrounding the practice can be seen in the survey results:
|
Of the individuals surveyed, 52.9% responded either "unlikely" or "never" to the question of how likely they would be to vote a split ticket. Only 29.4%, on the other hand, responded that it was "possible" or "likely". This negative perception of split ticket voting is a sign of sharp polarization in American politics, and only serves to discourage bipartisanship, cooperation, and compromise.
|
|
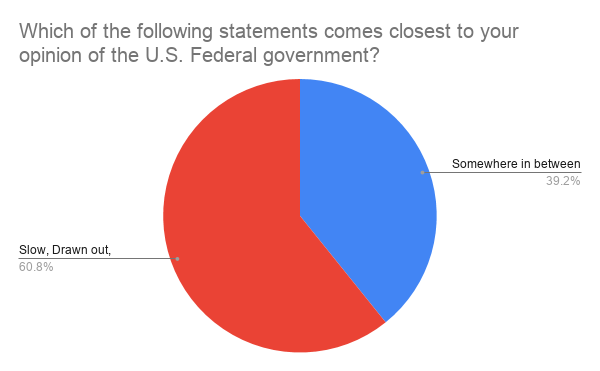
One broad topic that the individuals surveyed seemed to agree on was their general opinion of the federal government. In the demographics section of the survey, individuals were posed the question:
Which of the following statements comes closest to your opinion of the U.S. Federal government?
The options for responses included:
Which of the following statements comes closest to your opinion of the U.S. Federal government?
The options for responses included:
- Helpful, hardworking
- Somewhere in between
- Slow, drawn out, inefficient